







Gold has long held a special place in global asset allocation. Unlike stocks tied to corporate earnings, its price moves are shaped by a mix of macroeconomic signals, market sentiment and capital flows. Many new investors struggle to separate noise from useful signals and end up guessing blindly. A structured analysis framework helps you read gold trends more objectively.
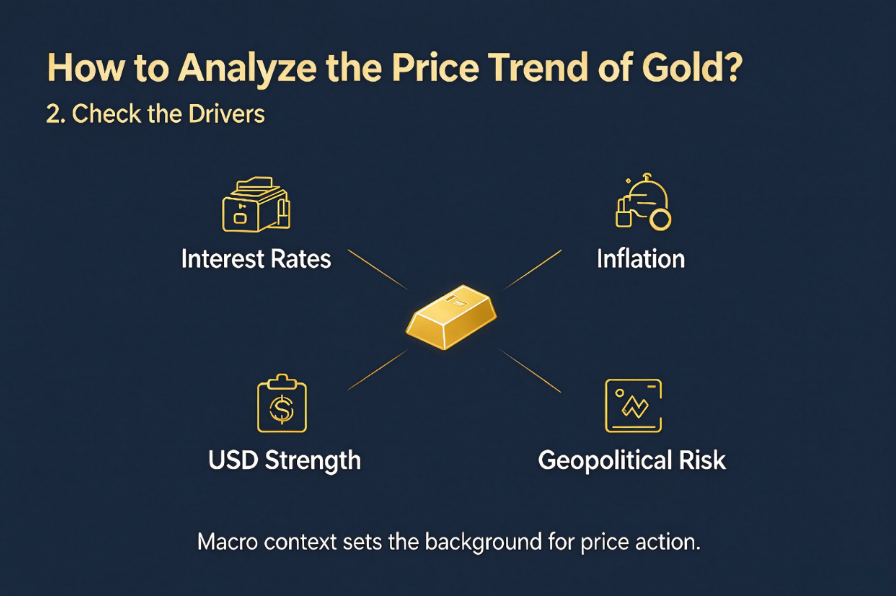
Fundamental analysis builds the big picture. Since gold is quoted in US dollars, the strength of the USD is one of the most direct drivers. A stronger dollar usually makes gold more expensive for overseas buyers and weighs on prices, while a weaker dollar often creates upward support. Interest rate expectations are equally critical. When real yields rise, the opportunity cost of holding non-yielding gold increases, which tends to cap rallies. Key releases such as inflation reports and central bank policy statements can shift market expectations quickly and trigger sharp swings. Beyond that, gold’s safe-haven demand picks up when geopolitical tensions or market instability rise, and central bank buying has also become a lasting structural support factor in recent years.
Technical analysis helps you locate timing and key levels. A top-down approach works best: start with weekly or daily charts to confirm the main trend, then zoom into shorter timeframes for entry and exit references. The basic rule is simple: an uptrend forms with higher highs and higher lows; a downtrend shows lower highs and lower lows; sideways consolidation means price swings between defined support and resistance zones. Popular tools include moving averages to filter trend direction, RSI for momentum checks, and Fibonacci retracements to spot potential pullback zones. Remember, no single indicator works perfectly on its own. It is safer to wait for multiple signals to align instead of trading based on one candle pattern.
Sentiment and positioning add another layer. Market positioning data shows whether most traders are leaning bullish or bearish. Extreme crowd sentiment often precedes a reversal, while steady inflows into gold-related instruments can reinforce an existing trend. This part reminds investors that market psychology sometimes overrides fundamental logic, especially during periods of high volatility.
Even with a solid analytical method, reliable market data and smooth chart access matter a lot. You need stable quotes, clear charting tools and timely market updates to turn your analysis into actionable observations. Many traders choose platforms that prioritise transparent precious metals market data and user-friendly trading interfaces. UPWAY Global is one platform focused on precious metals markets, offering intuitive charting functions and round-the-clock market information for investors who want to track gold trends conveniently. It removes much of the friction when you follow XAUUSD movements and test your analysis ideas.
No analysis can guarantee accurate predictions, and gold remains highly volatile. Good trend analysis is not about forecasting every peak and trough; it is about understanding the dominant market driver, identifying high-probability zones and managing risk properly. Whether you follow gold for long-term portfolio diversification or short-term market opportunities, building your own analytical routine is the most valuable step.
Disclaimer:This content is for informational purposes only and should not be construed as financial advice.